Analysis: Completely randomized design by glm
DIC.glm.RdStatistical analysis of experiments conducted in a completely randomized design using a generalized linear model. It performs the deviance analysis and the effect is tested by a chi-square test. Multiple comparisons are adjusted by Tukey.
DIC.glm(
  trat,
  response,
  glm.family = "binomial",
  quali = TRUE,
  alpha.f = 0.05,
  alpha.t = 0.05,
  geom = "bar",
  theme = theme_classic(),
  sup = NA,
  ylab = "Response",
  xlab = "",
  fill = "lightblue",
  angle = 0,
  family = "sans",
  textsize = 12,
  labelsize = 5,
  dec = 3,
  addmean = TRUE,
  errorbar = TRUE,
  posi = "top",
  point = "mean_sd",
  angle.label = 0
)
Arguments
- trat
Numerical or complex vector with treatments
- response
Numerical vector containing the response of the experiment. Use cbind(resp, n-resp) for binomial or quasibinomial family.
- glm.family
distribution family considered (default is binomial)
- quali
Defines whether the factor is quantitative or qualitative (default is qualitative)
- alpha.f
Level of significance of the F test (default is 0.05)
- alpha.t
Significance level of the multiple comparison test (default is 0.05)
- geom
Graph type (columns, boxes or segments)
- theme
ggplot2 theme (default is theme_classic())
- sup
Number of units above the standard deviation or average bar on the graph
- ylab
Variable response name (Accepts the expression() function)
- xlab
Treatments name (Accepts the expression() function)
- fill
Defines chart color (to generate different colors for different treatments, define fill = "trat")
- angle
x-axis scale text rotation
- family
Font family
- textsize
Font size
- labelsize
Label size
- dec
Number of cells
- addmean
Plot the average value on the graph (default is TRUE)
- errorbar
Plot the standard deviation bar on the graph (In the case of a segment and column graph) - default is TRUE
- posi
Legend position
- point
Defines whether to plot mean ("mean"), mean with standard deviation ("mean_sd" - default) or mean with standard error (default - "mean_se").
- angle.label
label angle
Examples
data("aristolochia")
attach(aristolochia)
#> The following objects are masked from simulate2:
#>
#> resp, trat
#> The following objects are masked from laranja:
#>
#> resp, trat
#> The following objects are masked from aristolochia (pos = 5):
#>
#> resp, trat
#> The following object is masked from cloro:
#>
#> resp
#> The following object is masked from passiflora:
#>
#> trat
#=============================
# Use the DIC function
#=============================
DIC(trat, resp)
#>
#> -----------------------------------------------------------------
#> Normality of errors
#> -----------------------------------------------------------------
#> Method Statistic p.value
#> Shapiro-Wilk normality test(W) 0.9012191 1.371547e-05
#>
#> As the calculated p-value is less than the 5% significance level, H0 is rejected. Therefore, errors do not follow a normal distribution
#>
#> -----------------------------------------------------------------
#> Homogeneity of Variances
#> -----------------------------------------------------------------
#> Method Statistic p.value
#> Bartlett test(Bartlett's K-squared) 959.635 1.994778e-206
#>
#> As the calculated p-value is less than the 5% significance level, H0 is rejected.Therefore, the variances are not homogeneous
#>
#> -----------------------------------------------------------------
#> Independence from errors
#> -----------------------------------------------------------------
#> Method Statistic p.value
#> Durbin-Watson test(DW) 1.317091 0.000140062
#>
#> As the calculated p-value is less than the 5% significance level, H0 is rejected.Therefore, errors are not independent
#>
#> -----------------------------------------------------------------
#> Additional Information
#> -----------------------------------------------------------------
#>
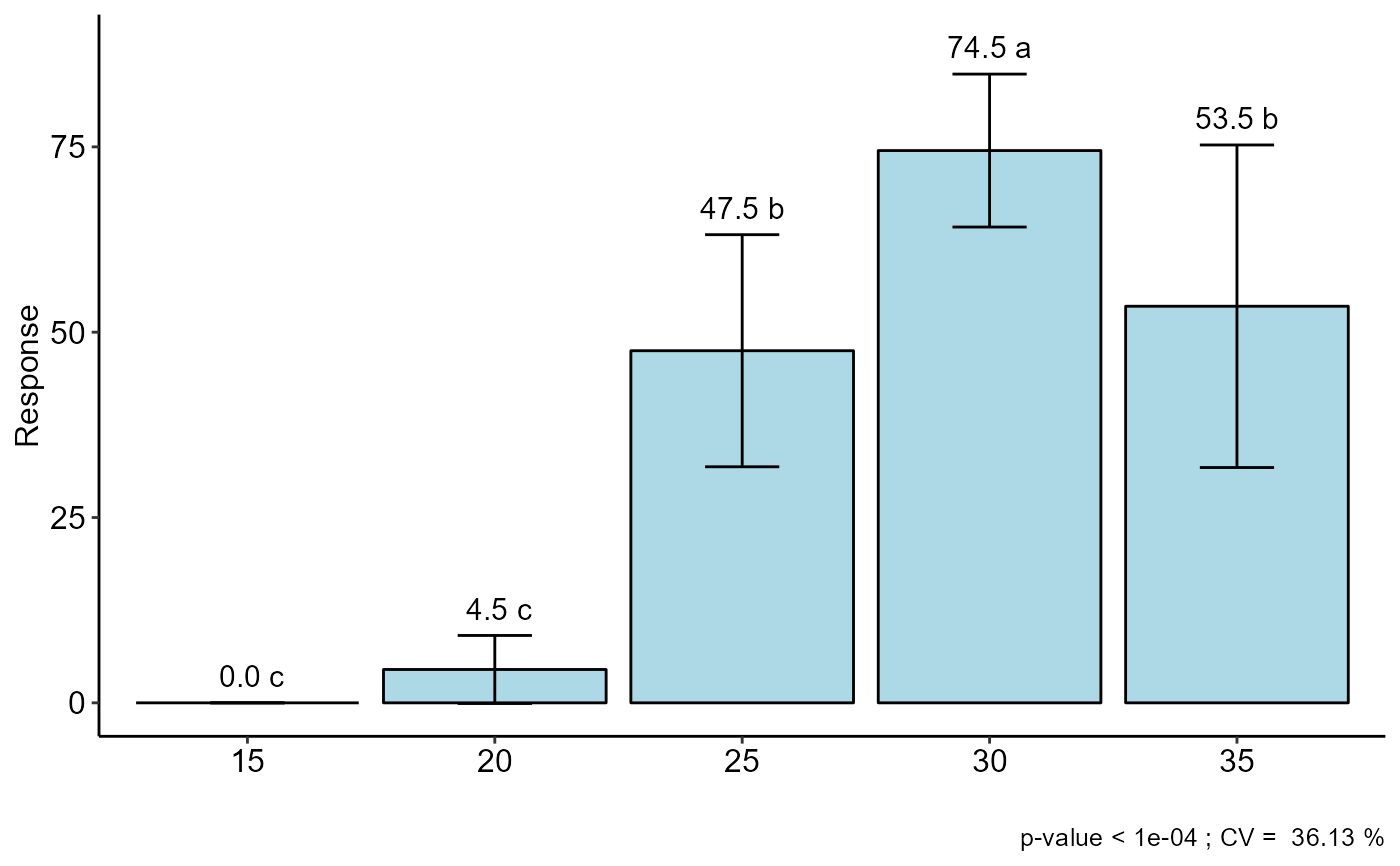
#> CV (%) = 36.13
#> MStrat/MST = 0.99
#> Mean = 36
#> Median = 36
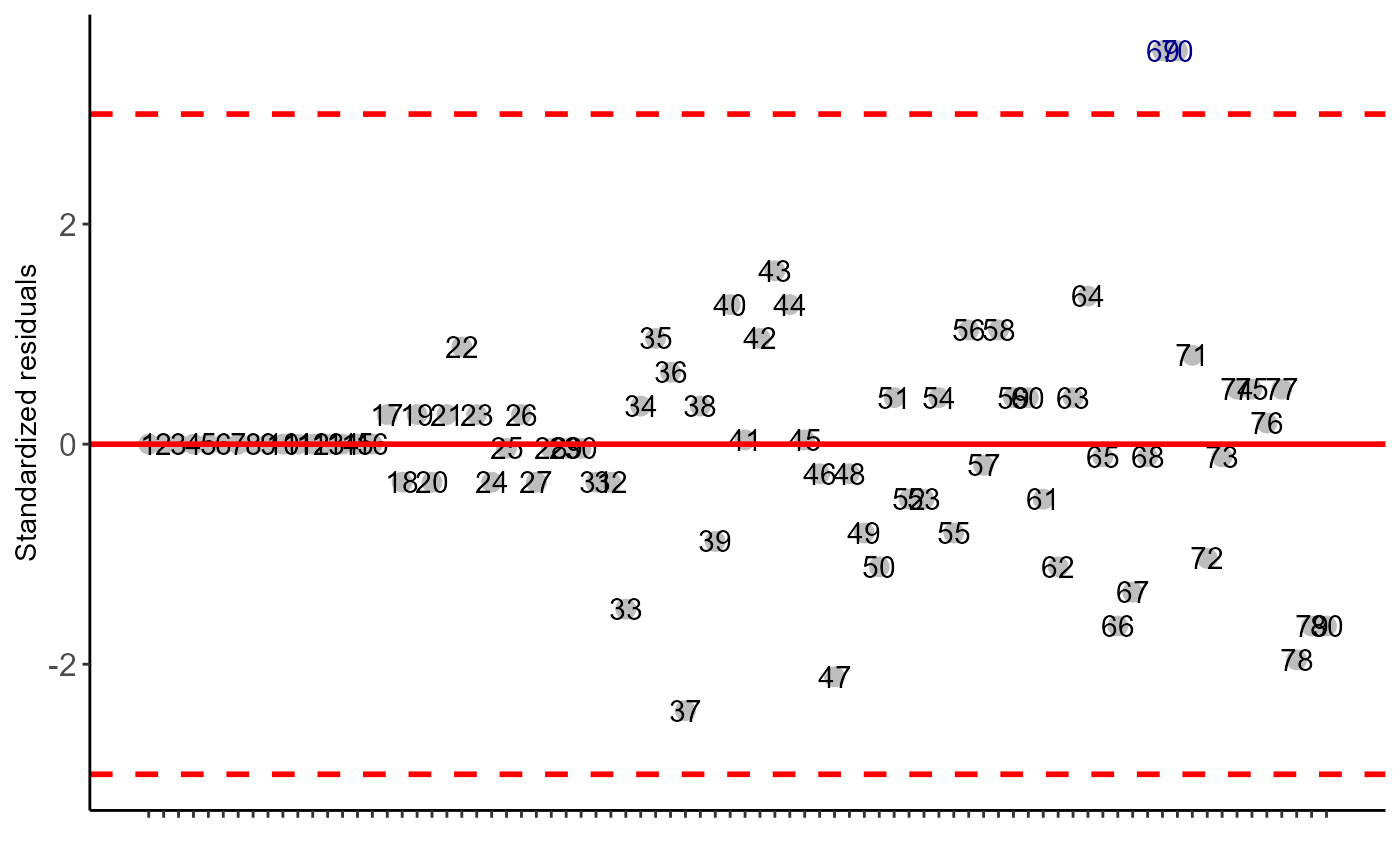
#> Possible outliers = 69 70
#>
#> -----------------------------------------------------------------
#> Analysis of Variance
#> -----------------------------------------------------------------
#> Df Sum Sq Mean.Sq F value Pr(F)
#> trat 4 67344 16836.0000 99.51923 3.292095e-29
#> Residuals 75 12688 169.1733
#>
#>
#> As the calculated p-value, it is less than the 5% significance level.The hypothesis H0 of equality of means is rejected. Therefore, at least two treatments differ
#>
#>
#> -----------------------------------------------------------------
#> Multiple Comparison Test: Tukey HSD
#> -----------------------------------------------------------------
#> resp groups
#> 30 74.5 a
#> 35 53.5 b
#> 25 47.5 b
#> 20 4.5 c
#> 15 0.0 c
#>
#>
#>
#> Your analysis is not valid, suggests using a non-parametric test and try to transform the data
 #=============================
# Use the DIC function noparametric
#=============================
DIC(trat, resp, test="noparametric")
#>
#>
#> -----------------------------------------------------------------
#> Statistics
#> -----------------------------------------------------------------
#> Chisq p.chisq
#> 67.22819 8.726353e-14
#>
#>
#> -----------------------------------------------------------------
#> Parameters
#> -----------------------------------------------------------------
#> test p.ajusted name.t ntr alpha
#> Kruskal-Wallis holm trat 5 0.05
#>
#>
#> -----------------------------------------------------------------
#> Multiple Comparison Test: LSD
#> -----------------------------------------------------------------
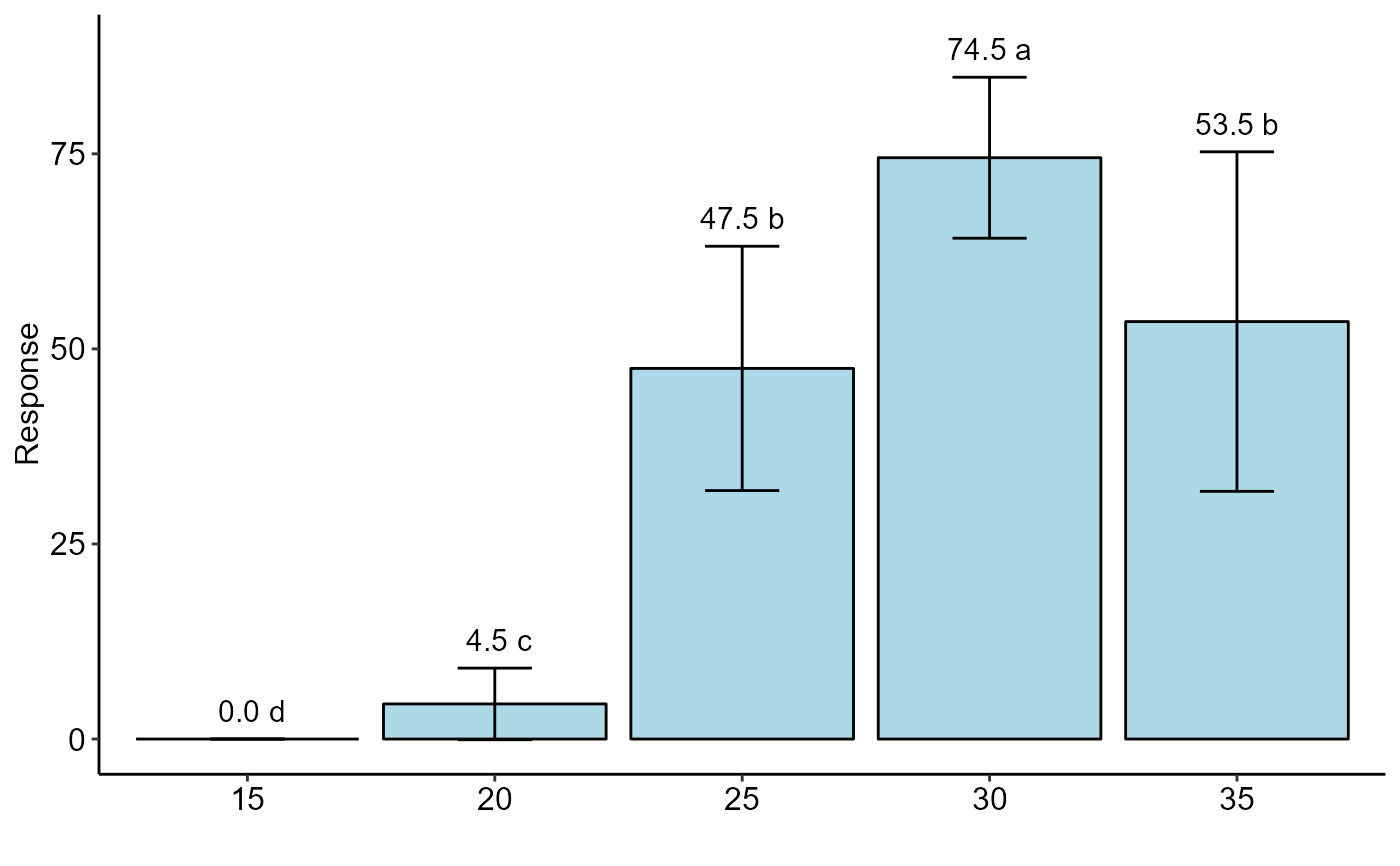
#> Mean SD Rank Groups
#> 15 0.0 0.000000 11.50000 d
#> 20 4.5 4.589844 21.53125 c
#> 25 47.5 15.654605 48.65625 b
#> 30 74.5 10.315038 69.28125 a
#> 35 53.5 21.756225 51.53125 b
#=============================
# Use the DIC function noparametric
#=============================
DIC(trat, resp, test="noparametric")
#>
#>
#> -----------------------------------------------------------------
#> Statistics
#> -----------------------------------------------------------------
#> Chisq p.chisq
#> 67.22819 8.726353e-14
#>
#>
#> -----------------------------------------------------------------
#> Parameters
#> -----------------------------------------------------------------
#> test p.ajusted name.t ntr alpha
#> Kruskal-Wallis holm trat 5 0.05
#>
#>
#> -----------------------------------------------------------------
#> Multiple Comparison Test: LSD
#> -----------------------------------------------------------------
#> Mean SD Rank Groups
#> 15 0.0 0.000000 11.50000 d
#> 20 4.5 4.589844 21.53125 c
#> 25 47.5 15.654605 48.65625 b
#> 30 74.5 10.315038 69.28125 a
#> 35 53.5 21.756225 51.53125 b
 #=============================
# Use the DIC.glm function
#=============================
resp=resp/4 # total germinated seeds
# the value 25 is the total of seeds in the repetition
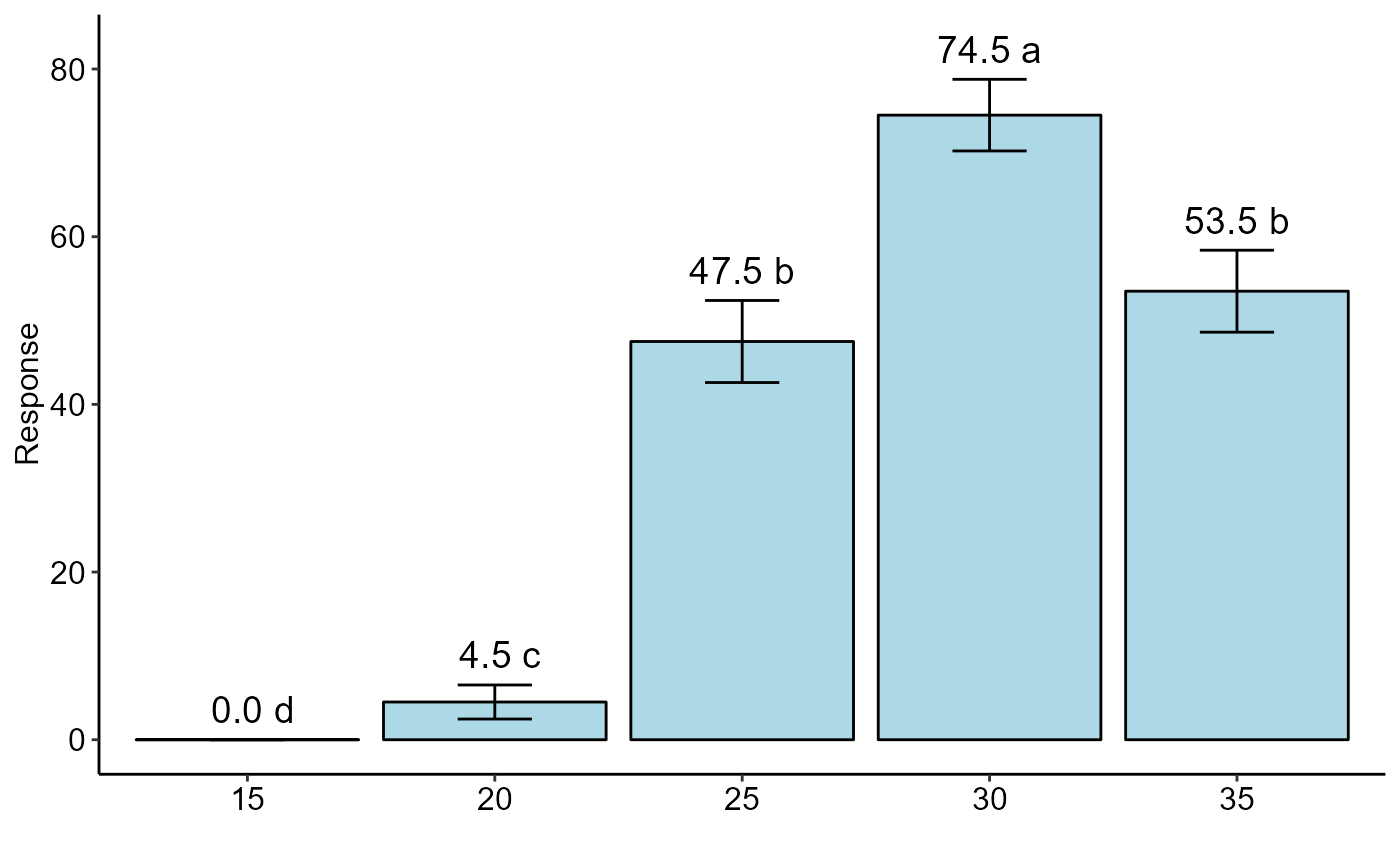
DIC.glm(trat, cbind(resp,25-resp), glm.family="binomial")
#>
#>
#> -----------------------------------------------------------------
#> Analysis of deviance
#> -----------------------------------------------------------------
#>
#> Null deviance 1079.917
#> Df Null deviance 79.000
#> -----
#> Residual deviance 173.344
#> Df residual deviance 75.000
#> p-value(Chisq) 0.000
#> -----
#> AIC 368.183
#>
#>
#> As the calculated p-value, it is less than the 5% significance level.The hypothesis H0 of equality of means is rejected. Therefore, at least two treatments differ
#>
#>
#> -----------------------------------------------------------------
#> Multiple Comparison Test
#> -----------------------------------------------------------------
#> trat prob SE asymp.LCL asymp.UCL .group
#> 15 15 0.00 0.00 0.00 0.00 d
#> 20 20 0.05 0.01 0.02 0.07 c
#> 25 25 0.47 0.02 0.43 0.52 b
#> 30 30 0.74 0.02 0.70 0.79 a
#> 35 35 0.53 0.02 0.49 0.58 b
#=============================
# Use the DIC.glm function
#=============================
resp=resp/4 # total germinated seeds
# the value 25 is the total of seeds in the repetition
DIC.glm(trat, cbind(resp,25-resp), glm.family="binomial")
#>
#>
#> -----------------------------------------------------------------
#> Analysis of deviance
#> -----------------------------------------------------------------
#>
#> Null deviance 1079.917
#> Df Null deviance 79.000
#> -----
#> Residual deviance 173.344
#> Df residual deviance 75.000
#> p-value(Chisq) 0.000
#> -----
#> AIC 368.183
#>
#>
#> As the calculated p-value, it is less than the 5% significance level.The hypothesis H0 of equality of means is rejected. Therefore, at least two treatments differ
#>
#>
#> -----------------------------------------------------------------
#> Multiple Comparison Test
#> -----------------------------------------------------------------
#> trat prob SE asymp.LCL asymp.UCL .group
#> 15 15 0.00 0.00 0.00 0.00 d
#> 20 20 0.05 0.01 0.02 0.07 c
#> 25 25 0.47 0.02 0.43 0.52 b
#> 30 30 0.74 0.02 0.70 0.79 a
#> 35 35 0.53 0.02 0.49 0.58 b