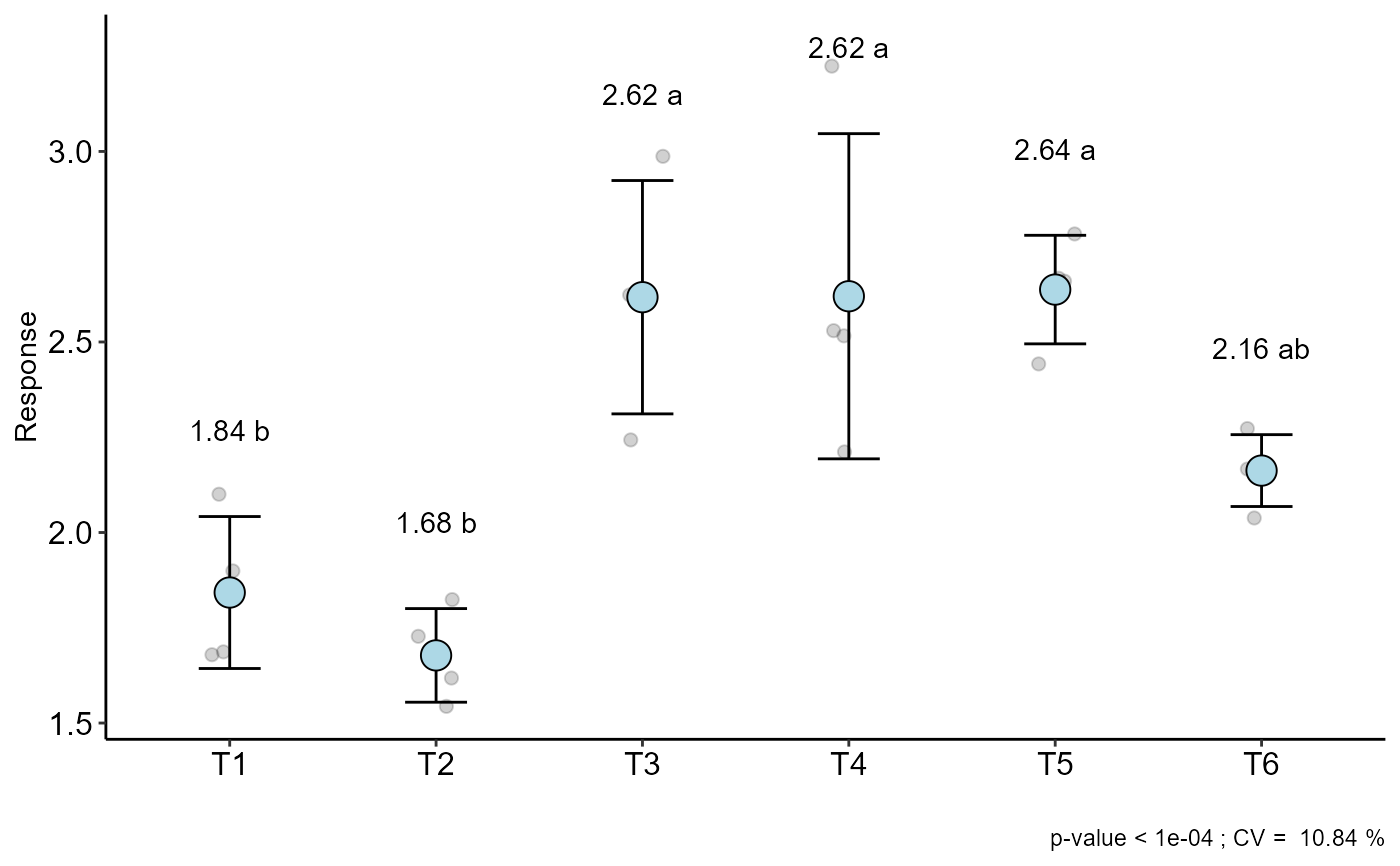
Graph: Column, box or segment chart with observations
plot_jitter.RdThe function performs the construction of graphs of boxes, columns or segments with all the observations represented in the graph.
plot_jitter(model)Arguments
- model
DIC, DBC or DQL object
Value
Returns with graph of boxes, columns or segments with all the observations represented in the graph.
Examples
data("pomegranate")
a=with(pomegranate,DIC(trat,WL,geom="point"))
#>
#> -----------------------------------------------------------------
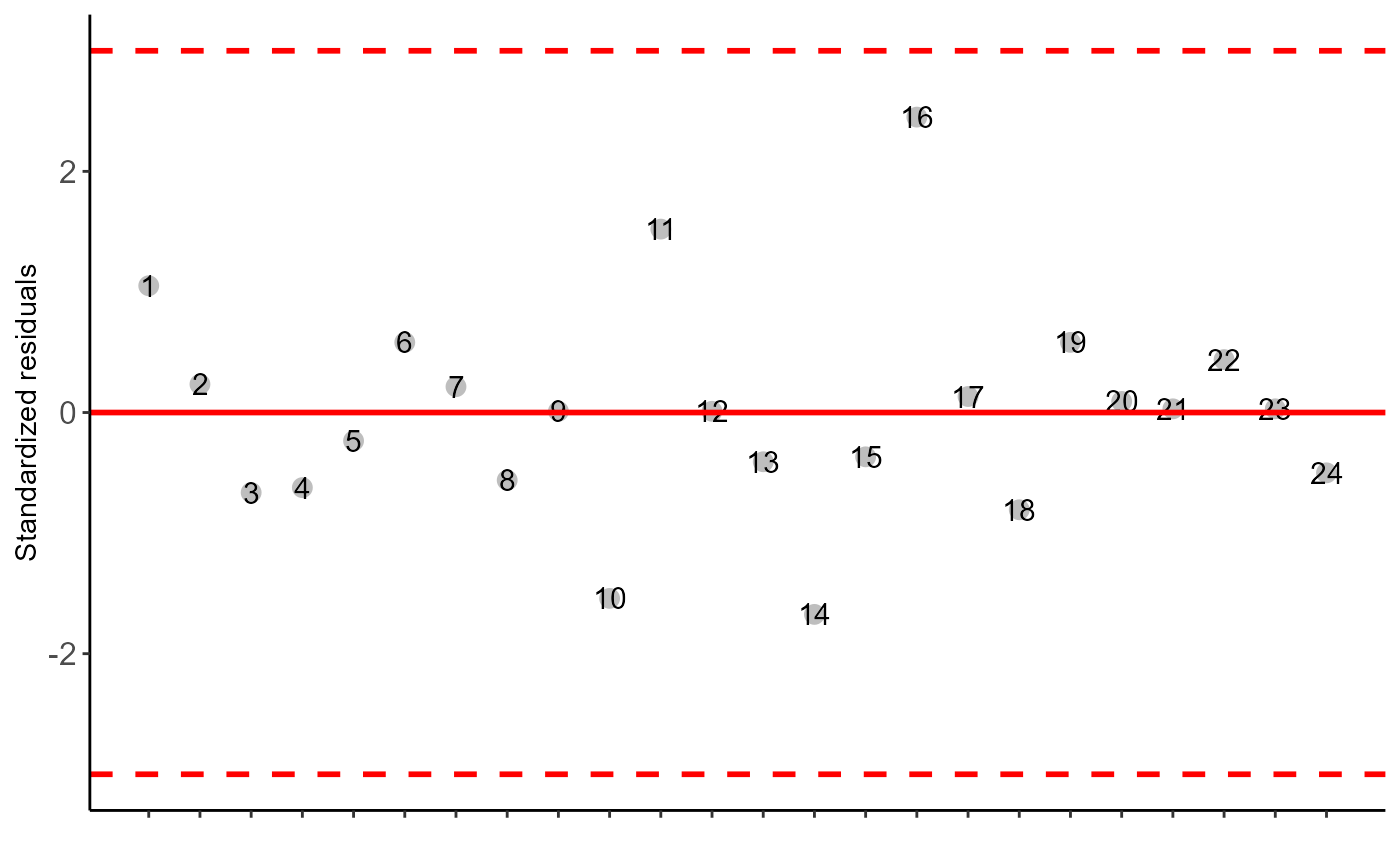
#> Normality of errors
#> -----------------------------------------------------------------
#> Method Statistic p.value
#> Shapiro-Wilk normality test(W) 0.9448293 0.2087967
#>
#> As the calculated p-value is greater than the 5% significance level, hypothesis H0 is not rejected. Therefore, errors can be considered normal
#>
#> -----------------------------------------------------------------
#> Homogeneity of Variances
#> -----------------------------------------------------------------
#> Method Statistic p.value
#> Bartlett test(Bartlett's K-squared) 8.568274 0.1275737
#>
#> As the calculated p-value is greater than the 5% significance level,hypothesis H0 is not rejected. Therefore, the variances can be considered homogeneous
#>
#> -----------------------------------------------------------------
#> Independence from errors
#> -----------------------------------------------------------------
#> Method Statistic p.value
#> Durbin-Watson test(DW) 2.104821 0.1924474
#>
#> As the calculated p-value is greater than the 5% significance level, hypothesis H0 is not rejected. Therefore, errors can be considered independent
#>
#> -----------------------------------------------------------------
#> Additional Information
#> -----------------------------------------------------------------
#>
#> CV (%) = 10.84
#> MStrat/MST = 0.92
#> Mean = 2.2596
#> Median = 2.225
#> Possible outliers = No discrepant point
#>
#> -----------------------------------------------------------------
#> Analysis of Variance
#> -----------------------------------------------------------------
#> Df Sum Sq Mean.Sq F value Pr(F)
#> trat 5 3.692121 0.73842417 12.31191 2.723541e-05
#> Residuals 18 1.079575 0.05997639
#>
#>
#> As the calculated p-value, it is less than the 5% significance level.The hypothesis H0 of equality of means is rejected. Therefore, at least two treatments differ
#>
#>
#> -----------------------------------------------------------------
#> Multiple Comparison Test: Tukey HSD
#> -----------------------------------------------------------------
#> resp groups
#> T5 2.6375 a
#> T4 2.6200 a
#> T3 2.6175 a
#> T6 2.1625 ab
#> T1 1.8425 b
#> T2 1.6775 b
#>
#>
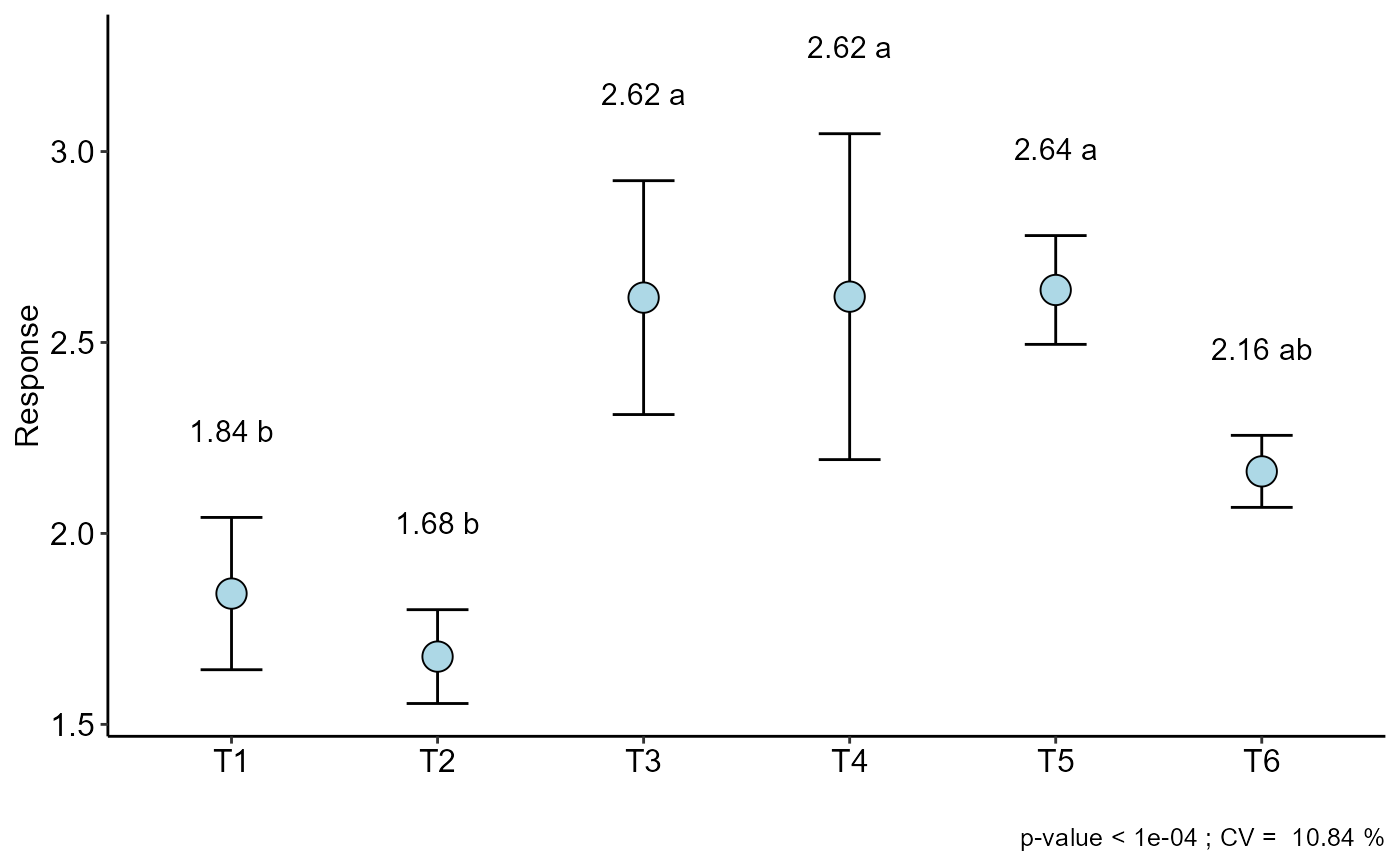 plot_jitter(a)