Analysis: Linear regression graph
polynomial.RdLinear regression analysis of an experiment with a quantitative factor or isolated effect of a quantitative factor
polynomial(
  trat,
  resp,
  ylab = "Response",
  xlab = "Independent",
  yname.poly = "y",
  xname.poly = "x",
  grau = NA,
  theme = theme_classic(),
  point = "mean_sd",
  color = "gray80",
  posi = "top",
  textsize = 12,
  se = FALSE,
  ylim = NA,
  family = "sans",
  pointsize = 4.5,
  linesize = 0.8,
  width.bar = NA,
  n = NA,
  SSq = NA,
  DFres = NA
)
Arguments
- trat
Numerical vector with treatments (Declare as numeric)
- resp
Numerical vector containing the response of the experiment.
- ylab
Dependent variable name (Accepts the expression() function)
- xlab
Independent variable name (Accepts the expression() function)
- yname.poly
Y name in equation
- xname.poly
X name in equation
- grau
Degree of the polynomial (1, 2 or 3)
- theme
ggplot2 theme (default is theme_classic())
- point
Defines whether to plot mean ("mean"), all repetitions ("all"),mean with standard deviation ("mean_sd") or mean with standard error (default - "mean_se").
- color
Graph color (default is gray80)
- posi
Legend position
- textsize
Font size
- se
Adds confidence interval (default is FALSE)
- ylim
y-axis scale
- family
Font family
- pointsize
Point size
- linesize
line size (Trendline and Error Bar)
- width.bar
width of the error bars of a regression graph.
- n
Number of decimal places for regression equations
- SSq
Sum of squares of the residue
- DFres
Residue freedom degrees
Value
Returns linear, quadratic or cubic regression analysis.
See also
Examples
data("phao")
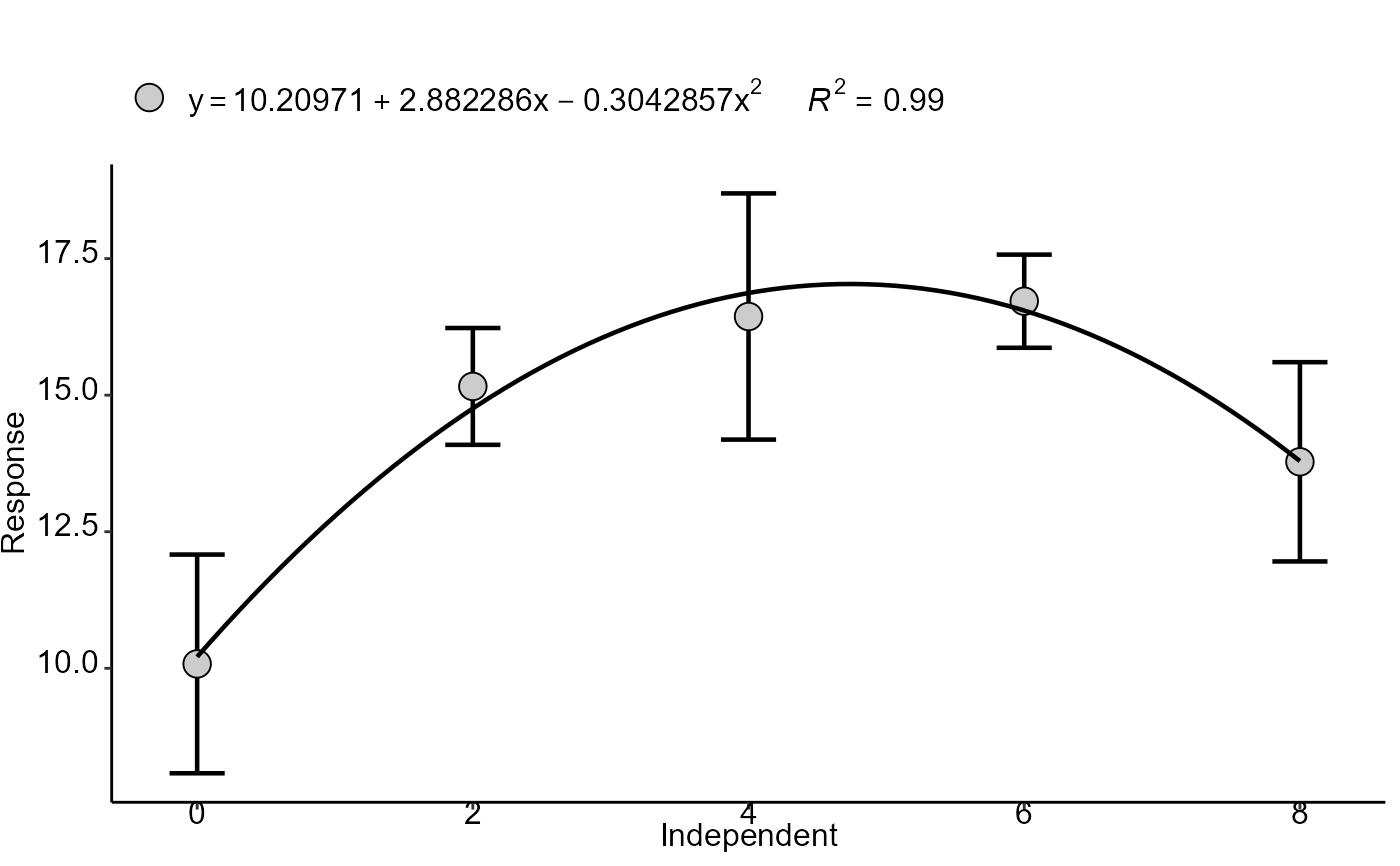
with(phao, polynomial(dose,comp, grau = 2))
#>
#> ----------------------------------------------------
#> Regression Models
#> ----------------------------------------------------
#> Estimate Std. Error t value Pr(>|t|)
#> (Intercept) 10.2097143 0.68981140 14.800733 6.427099e-13
#> trat 2.8822857 0.40856781 7.054608 4.456995e-07
#> I(trat^2) -0.3042857 0.04897332 -6.213296 2.971498e-06
#>
#> ----------------------------------------------------
#> Deviations from regression
#> ----------------------------------------------------
#> Df SSq MSQ F p-value
#> Linear 1 40.140800 40.1408000 14.0529338 1.265122e-03
#> Quadratic 1 103.700571 103.7005714 36.3046392 6.852202e-06
#> Deviation 2 1.968229 0.9841143 0.3445296 7.126767e-01
#> Residual 20 57.128000 2.8564000
#> [[1]]
 #>
#>