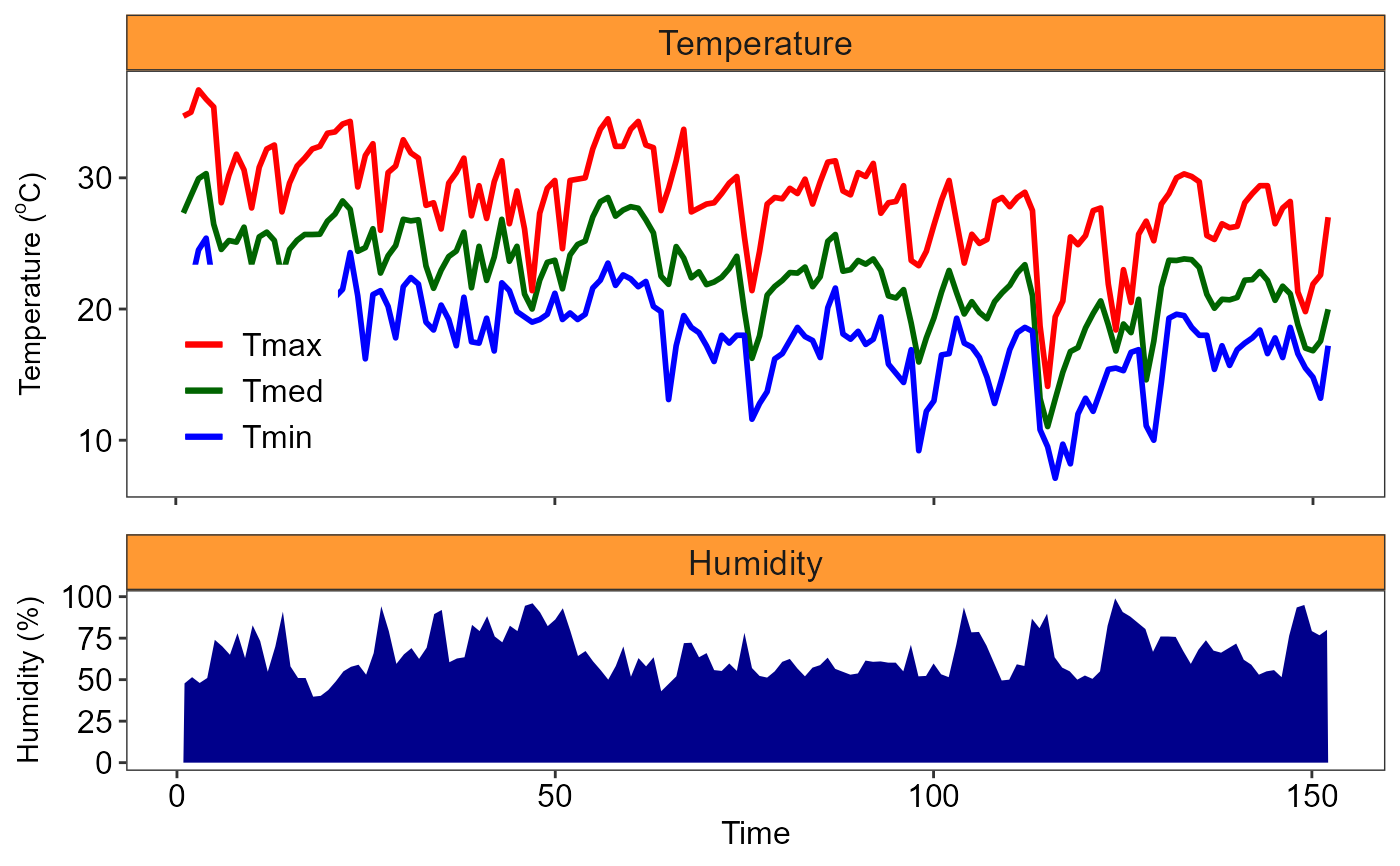
Graph: Climate chart of temperature and humidity (Model 2)
plot_TH1.RdThe plot_TH1 function allows the user to build a column/line graph with climatic parameters of temperature (maximum, minimum and average) and relative humidity (UR) or precipitation. This chart is widely used in scientific work in agrarian science
plot_TH1(
  tempo,
  Tmed,
  Tmax,
  Tmin,
  UR,
  xlab = "Time",
  yname1 = expression("Humidity (%)"),
  yname2 = expression("Temperature ("^o * "C)"),
  legend.T = "Temperature",
  legend.H = "Humidity",
  legend.tmed = "Tmed",
  legend.tmin = "Tmin",
  legend.tmax = "Tmax",
  colormax = "red",
  colormin = "blue",
  colormean = "darkgreen",
  fillarea = "darkblue",
  facet.fill = "#FF9933",
  panel.grid = FALSE,
  x = "days",
  breaks = "1 months",
  textsize = 12,
  legendsize = 12,
  titlesize = 12,
  linesize = 1,
  date_format = "%m-%Y",
  angle = 0,
  legend.position = c(0.1, 0.3)
)
Arguments
- tempo
Vector with times
- Tmed
Vector with mean temperature
- Tmax
Vector with maximum temperature
- Tmin
Vector with minimum temperature
- UR
Vector with relative humidity or precipitation
- xlab
x axis name
- yname1
y axis name
- yname2
Secondary y-axis name
- legend.T
faceted title legend 1
- legend.H
faceted title legend 2
- legend.tmed
Legend mean temperature
- legend.tmin
Legend minimum temperature
- legend.tmax
Legend maximum temperature
- colormax
Maximum line color (default is "red")
- colormin
Minimum line color (default is "blue")
- colormean
Midline color (default is "darkgreen")
- fillarea
area fill color (default is "darkblue")
- facet.fill
faceted title fill color (default is #FF9933)
- panel.grid
remove grid line (default is FALSE)
- x
x scale type (days or data, default is "days")
- breaks
Range for x scale when x = "date" (default is 1 months)
- textsize
Axis text size
- legendsize
Legend text size
- titlesize
Axis title size
- linesize
Line size
- date_format
Date format for x="data"
- angle
x-axis scale text rotation
- legend.position
Legend position
Value
Returns row and column graphs for graphical representation of air temperature and relative humidity. Graph normally used in scientific articles