Analysis: Principal components analysis
PCA_function.RdThis function performs principal component analysis.
PCA_function(
  data,
  scale = TRUE,
  text = TRUE,
  pointsize = 5,
  textsize = 12,
  labelsize = 4,
  linesize = 0.6,
  repel = TRUE,
  ylab = NA,
  xlab = NA,
  groups = NA,
  sc = 1,
  font.family = "sans",
  theme = theme_bw(),
  label.legend = "Cluster",
  type.graph = "biplot"
)
Arguments
- data
Data.frame with data set. Line name must indicate the treatment
- scale
Performs data standardization (default is TRUE)
- text
Add label (default is TRUE)
- pointsize
Point size (default is 5)
- textsize
Text size (default is 12)
- labelsize
Label size (default is 4)
- linesize
Line size (default is 0.8)
- repel
Avoid text overlay (default is TRUE)
- ylab
Names y-axis
- xlab
Names x-axis
- groups
Define grouping
- sc
Secondary axis scale ratio (default is 1)
- font.family
Font family (default is sans)
- theme
Theme ggplot2 (default is theme_bw())
- label.legend
Legend title (when group is not NA)
- type.graph
Type of chart (default is biplot)
Value
The eigenvalues and eigenvectors, the explanation percentages of each principal component, the correlations between the vectors with the principal components, as well as graphs are returned.
Details
The type.graph argument defines the graph that will be returned, in the case of "biplot" the biplot graph is returned with the first two main components and with eigenvalues and eigenvectors. In the case of "scores" only the treatment scores are returned, while for "cor" the correlations are returned. For "corPCA" a correlation between the vectors with the components is returned.
Examples
data(pomegranate)
medias=tabledesc(pomegranate)
#> WL SS AT ratio
#> T1 1.8425 14.225 0.900 16.23341
#> T2 1.6775 14.275 0.900 16.73232
#> T3 2.6175 15.000 0.975 15.48409
#> T4 2.6200 14.050 1.050 13.66667
#> T5 2.6375 14.350 1.075 13.50821
#> T6 2.1625 14.650 1.025 14.47664
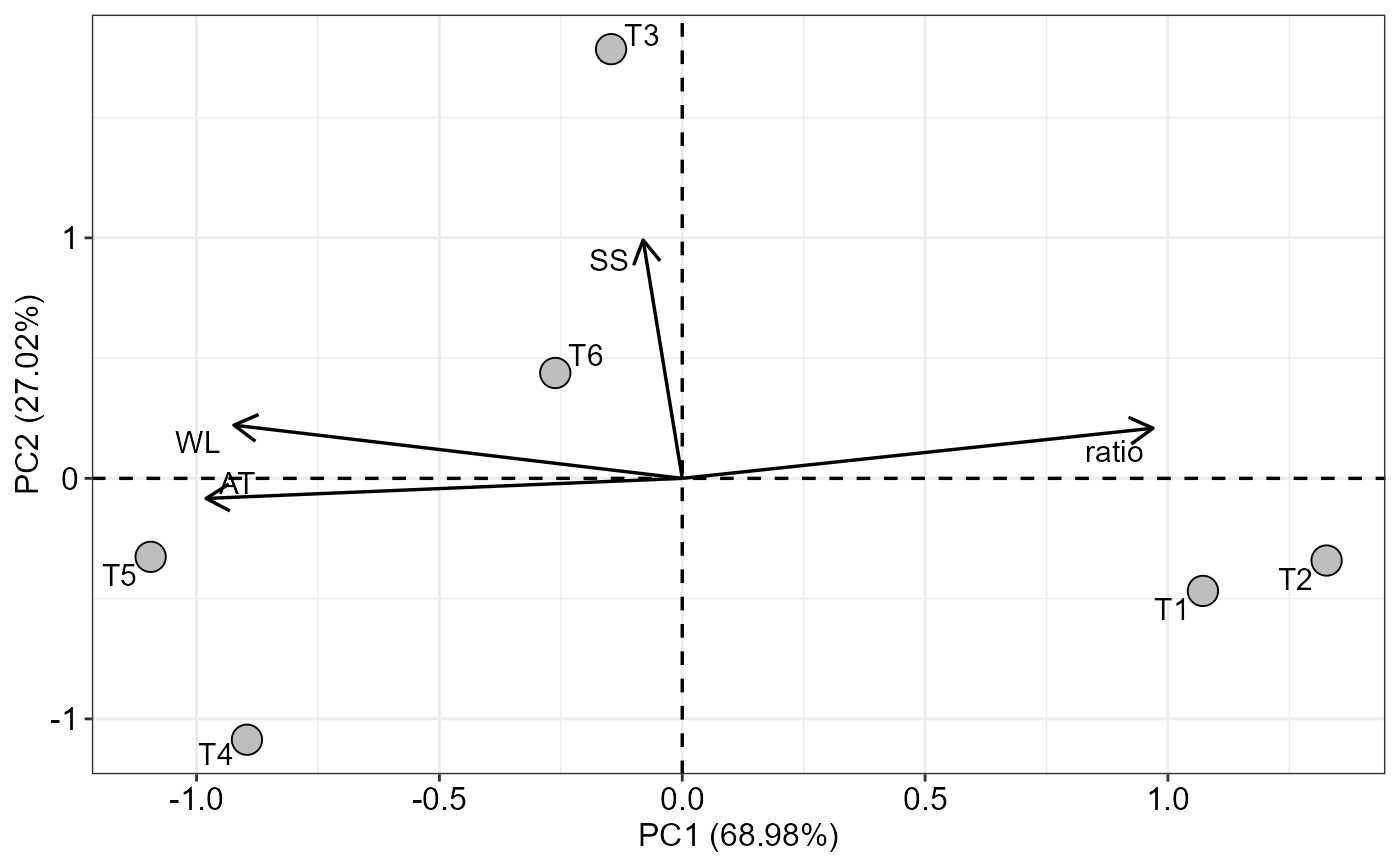
PCA_function(medias)
#> $Eigenvalue
#> PC1 PC2 PC3 PC4
#> Eigenvalue 2.759004 1.080884 0.15403977 0.006072350
#> Perc 0.689751 0.270221 0.03850994 0.001518088
#> CumPer 0.689751 0.959972 0.99848191 1.000000000
#>
#> $Eigenvector
#> PC1 PC2 PC3 PC4
#> WL -0.55572322 0.21280312 0.8015712 0.05805342
#> SS -0.04848491 0.95290788 -0.2786755 -0.10934227
#> AT -0.59014802 -0.08035566 -0.4366442 0.67424781
#> ratio 0.58356339 0.20056013 0.2986058 0.72805492
#>
#> $`Scores PCs`
#> PC1 PC2 PC3 PC4
#> T1 1.7806015 -0.4866147 0.16102815 -0.115996632
#> T2 2.2035824 -0.3551852 -0.07651296 0.116056752
#> T3 -0.2434196 1.8553698 0.37743090 0.006659998
#> T4 -1.4885719 -1.1298287 0.31476672 -0.004572330
#> T5 -1.8179840 -0.3392381 -0.07591359 0.039973602
#> T6 -0.4342084 0.4554968 -0.70079921 -0.042121390
#>
#> $`Correlation var x PC`
#> PC1 PC2 PC3 PC4
#> WL -0.92307012 0.22124199 0.3145999 0.004523830
#> SS -0.08053464 0.99069614 -0.1093743 -0.008520527
#> AT -0.98025058 -0.08354222 -0.1713737 0.052540953
#> ratio 0.96931335 0.20851349 0.1171965 0.056733887
#>
#> $graph
 #>
#>