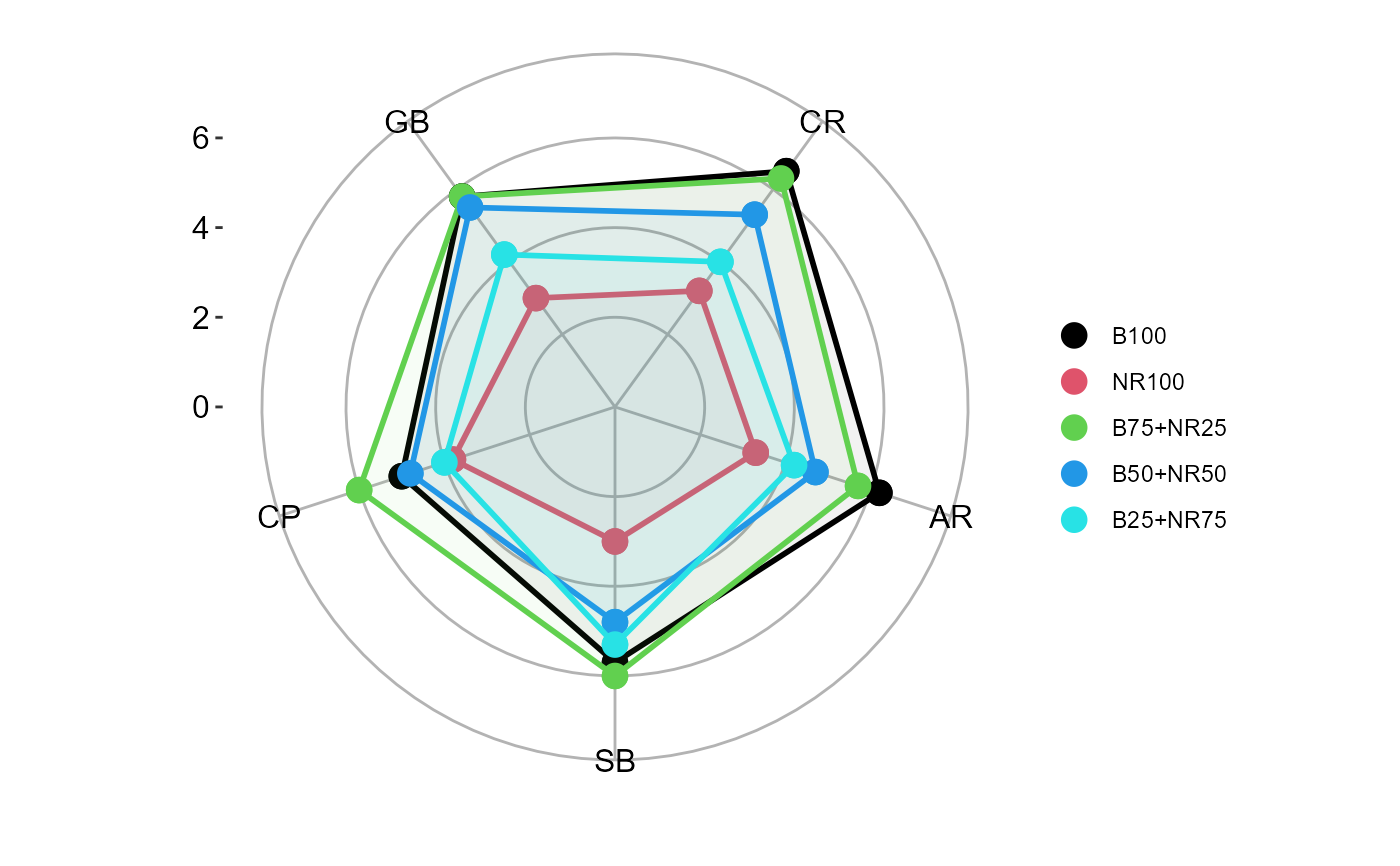
Graph: Spider graph for sensorial analysis
spider_graph.RdSpider chart or radar chart. Usually used for graphical representation of acceptability in sensory tests
spider_graph(
  resp,
  vari,
  blend,
  legend.title = "",
  xlab = "",
  ylab = "",
  ymin = 0
)
Arguments
- resp
Vector containing notes
- vari
Vector containing the variables
- blend
Vector containing treatments
- legend.title
Caption title
- xlab
x axis title
- ylab
y axis title
- ymin
Minimum value of y
Value
Returns a spider or radar chart. This graph is commonly used in studies of sensory analysis.