Graph: Plot correlation
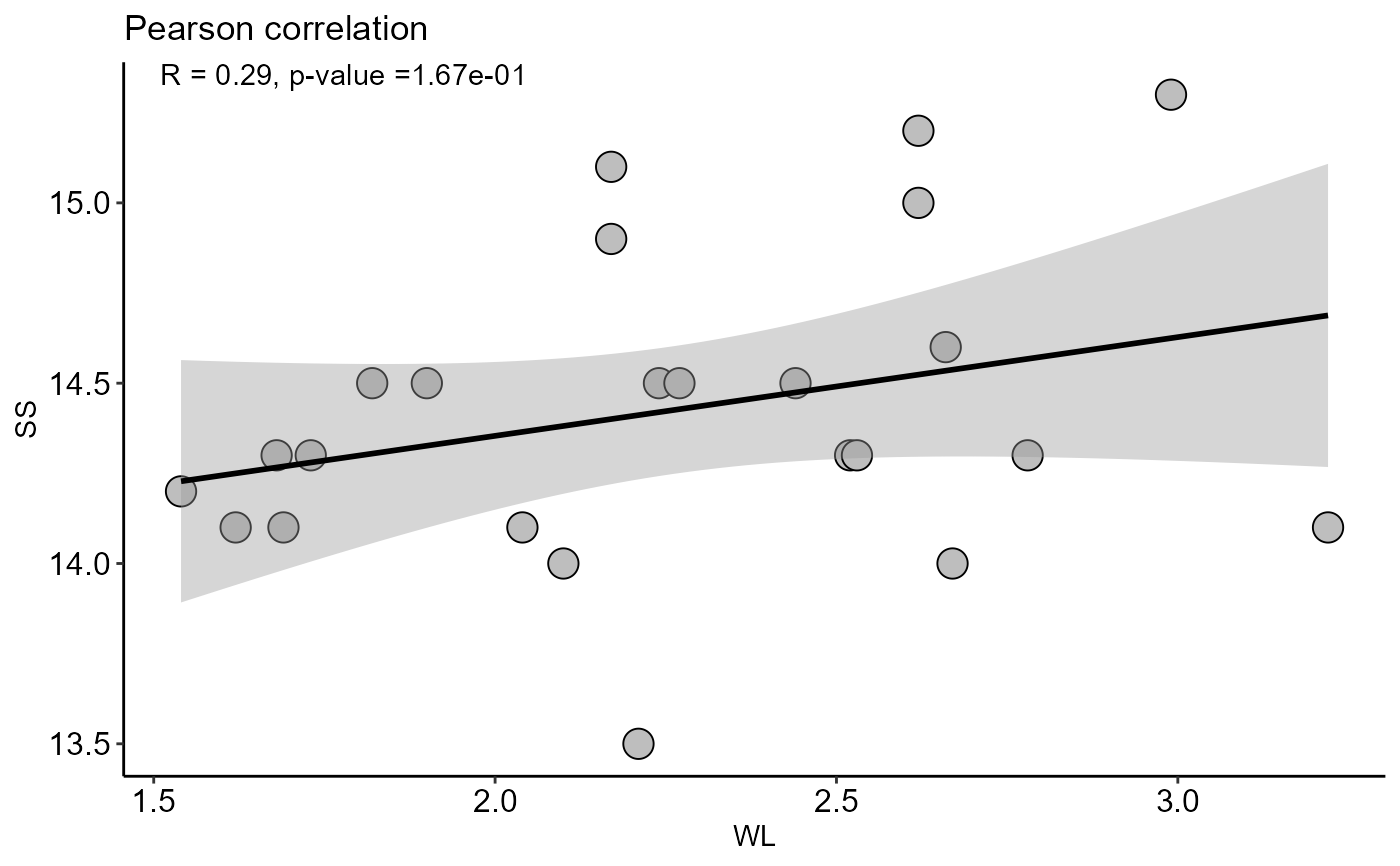
plot_cor.RdCorrelation analysis function (Pearson or Spearman)
plot_cor(
  x,
  y,
  method = "pearson",
  ylab = "Dependent",
  xlab = "Independent",
  theme = theme_classic(),
  pointsize = 5,
  shape = 21,
  fill = "gray",
  color = "black",
  axis.size = 12,
  ic = TRUE,
  title = NA,
  family = "sans"
)
Arguments
- x
Numeric vector with independent variable
- y
Numeric vector with dependent variable
- method
Method correlation (default is Pearson)
- ylab
Variable response name (Accepts the expression() function)
- xlab
Treatments name (Accepts the expression() function)
- theme
ggplot2 theme (default is theme_classic())
- pointsize
Point size
- shape
shape format
- fill
Fill point
- color
Color point
- axis.size
Axis text size
- ic
add interval of confidence
- title
title
- family
Font family
Value
The function returns a graph for correlation