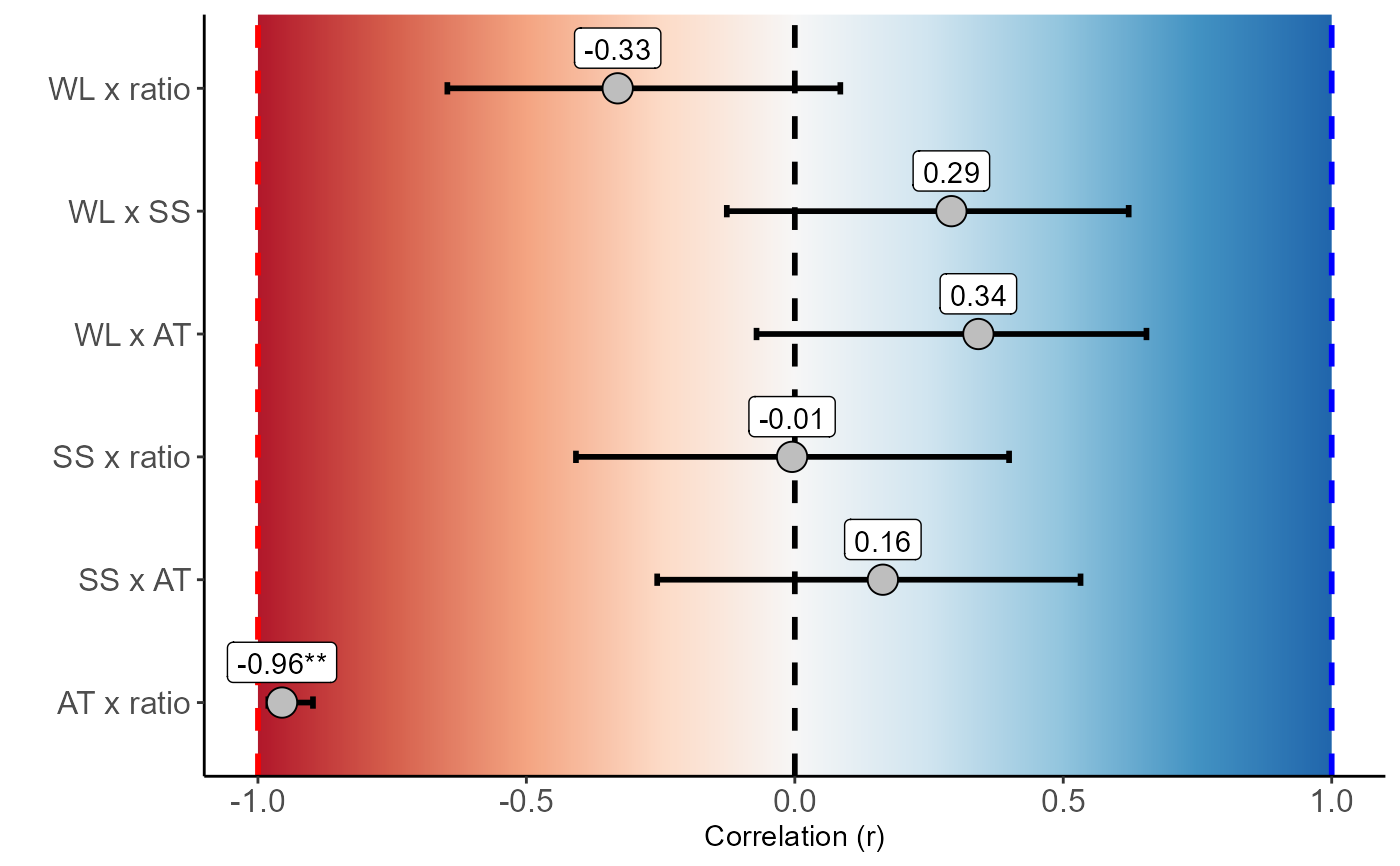
Graph: Plot Pearson correlation with interval of confidence
cor_ic.RdPlot Pearson correlation with interval of confidence
cor_ic(
  data,
  background = TRUE,
  axis.size = 12,
  ylab = "",
  xlab = "Correlation (r)",
  theme = theme_classic()
)
Arguments
- data
data.frame with responses
- background
background fill (default is TRUE)
- axis.size
Axes font size (default is 12)
- ylab
Variable response name (Accepts the expression() function)
- xlab
Treatments name (Accepts the expression() function)
- theme
ggplot theme (default is theme_classic())
Value
The function returns a new graphical approach to correlation.
Examples
data("pomegranate")
cor_ic(pomegranate[,-1])