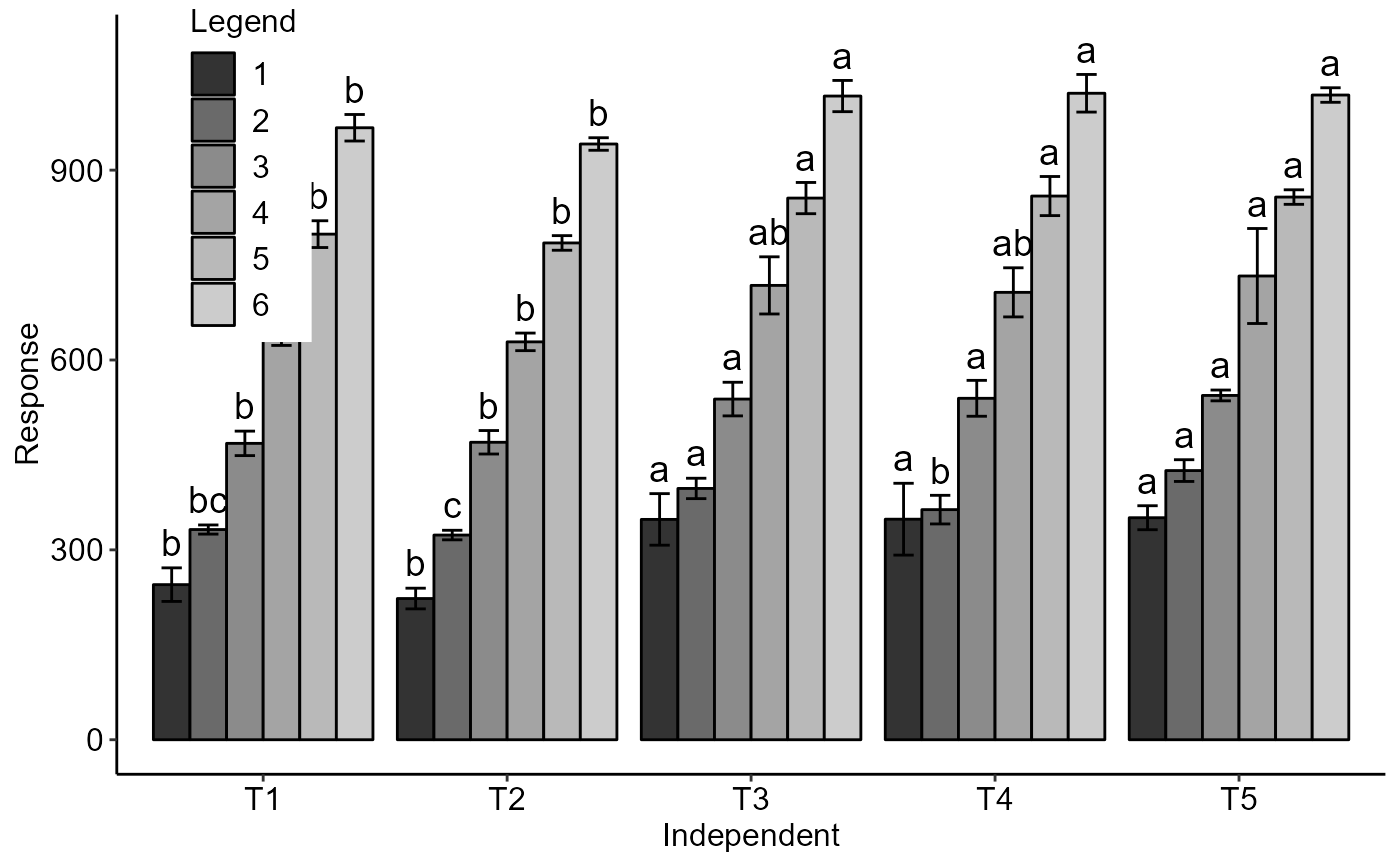
Graph: Reverse graph of DICT, DBCT and DQL output when geom="bar"
TBARPLOT.reverse.RdThe function performs the construction of a reverse graph on the output of DICT, DBCT and DQL when geom="bar".
TBARPLOT.reverse(plot.t)Arguments
- plot.t
DICT, DBCT or DQLT output when geom="bar"
Value
Returns a reverse graph of the output of DICT, DBCT or DQLT when geom="bar".
Note
All layout and subtitles are imported from DICT, DBCT and DQLT functions
Examples
data(simulate1)
a=with(simulate1, DICT(trat, tempo, resp,geom="bar",sup=40))
#>
#> -----------------------------------------------------------------
#> ANOVA and assumptions
#> -----------------------------------------------------------------
#> p-value ANOVA Shapiro-Wilk Bartlett Durbin-Watson CV (%)
#> 1 9.143052e-05 0.44610417 0.23369500 0.2379509 11.625285
#> 2 3.821815e-07 0.93845028 0.30786895 0.6600467 4.163316
#> 3 7.822709e-05 0.59104221 0.46541352 0.3244232 4.189412
#> 4 1.496061e-02 0.09984009 0.09849058 0.1332682 6.462590
#> 5 1.757687e-04 0.67552390 0.42726077 0.3008609 2.566743
#> 6 1.138255e-04 0.70461554 0.37578092 0.6357482 2.093636
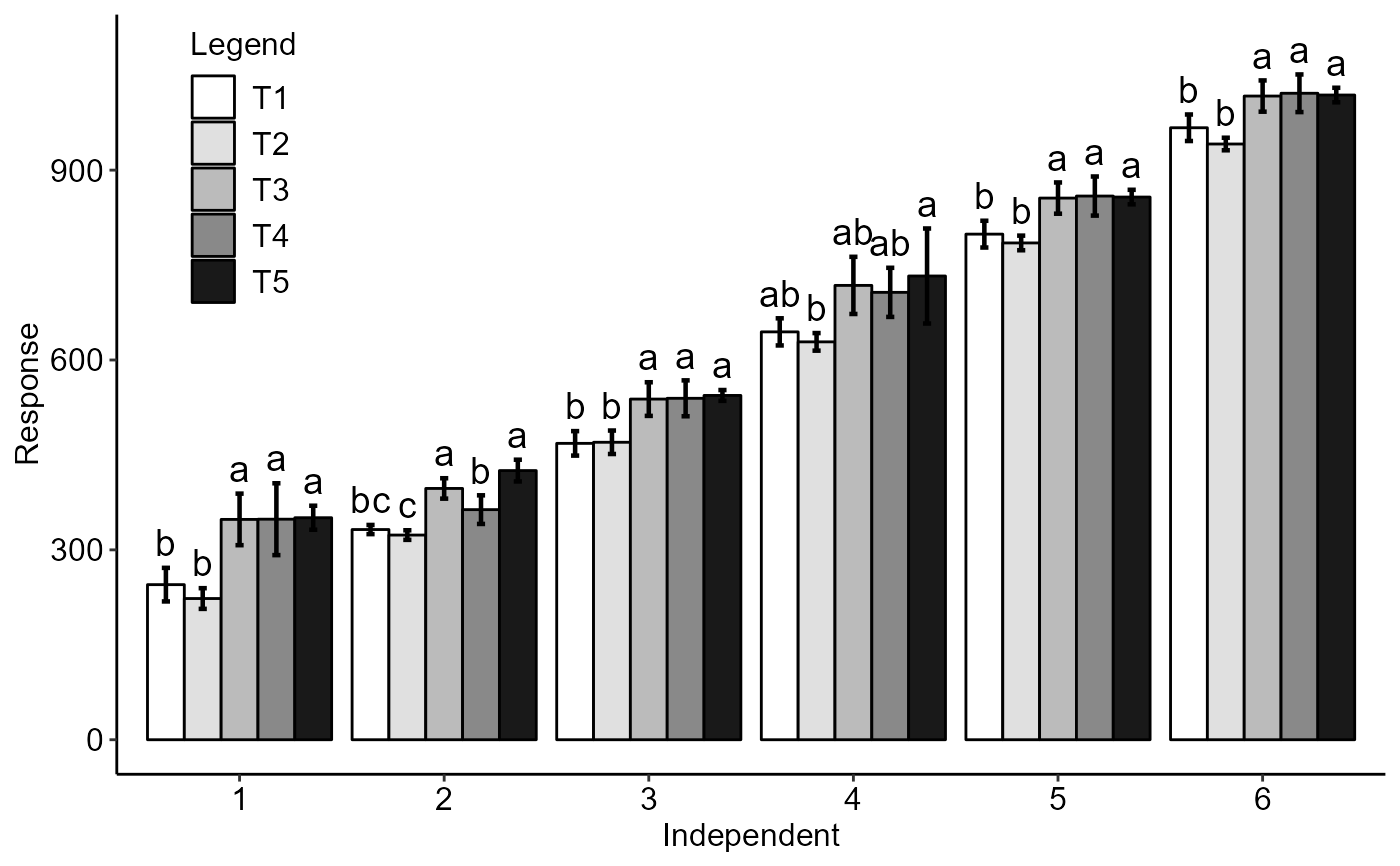 TBARPLOT.reverse(a)