Descriptive: Descriptive analysis (Two factors)
desc2fat.RdIt performs the descriptive analysis of an experiment with two factors of interest.
desc2fat(
  f1,
  f2,
  response,
  ylab = "Response",
  theme = theme_classic(),
  bar.fill.f1 = "lightblue",
  bar.fill.f2 = "lightgreen",
  lwd = 0.7,
  family = "sans",
  textsize = 12,
  pointsize = 4.5,
  width.bar = 0.2
)
Arguments
- f1
Numeric or complex vector with factor 1 levels
- f2
Numeric or complex vector with factor 2 levels
- response
Numerical vector containing the response of the experiment.
- ylab
Variable response name (Accepts the expression() function)
- theme
ggplot2 theme (default is theme_classic())
- bar.fill.f1
Fill column for f1 factor
- bar.fill.f2
Fill column for f2 factor
- lwd
Line size
- family
Font family (default is sans)
- textsize
Font size
- pointsize
Point size for interaction plot
- width.bar
Width errorbar
Value
The function returns exploratory measures of position and dispersion, such as mean, median, maximum, minimum, coefficient of variation, etc ...
Examples
library(AgroR)
data(cloro)
result=with(cloro, desc2fat(f1, f2, resp, family = "serif"))
#>
#> -----------------------------------------------------------------
#> general description
#> -----------------------------------------------------------------
#> Mean Median Min Max Variance SD CV
#> [1,] 218.35 185 32 492 18474.95 135.9226 62.24987
#>
#> -----------------------------------------------------------------
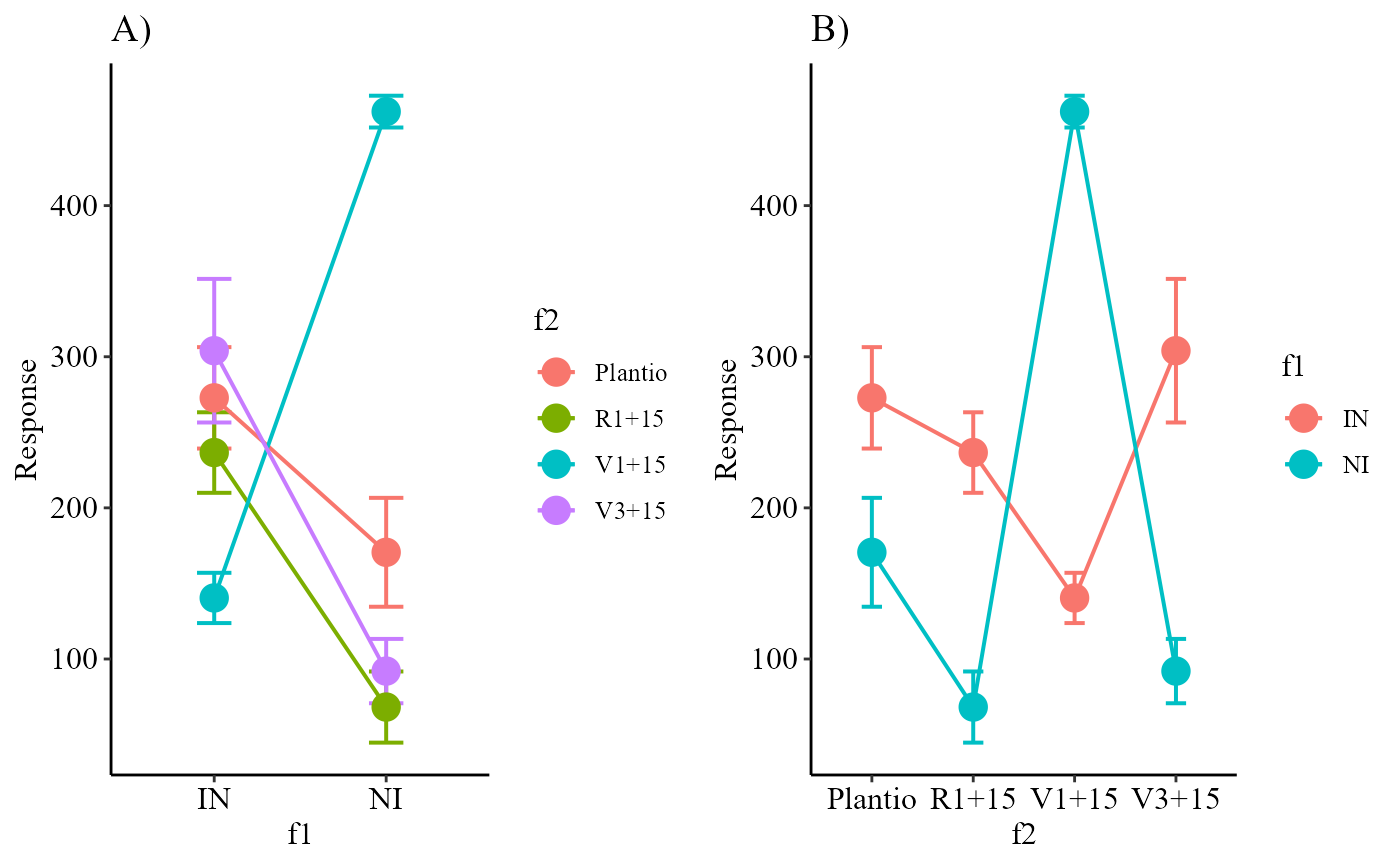
#> Interaction
#> -----------------------------------------------------------------
#> $Mean
#> Plantio R1+15 V1+15 V3+15
#> IN 272.8 236.6 140.4 304
#> NI 170.6 68.2 462.2 92
#>
#> $Median
#> Plantio R1+15 V1+15 V3+15
#> IN 300 222 161 258
#> NI 136 48 453 79
#>
#> $Min
#> Plantio R1+15 V1+15 V3+15
#> IN 163 174 83 196
#> NI 98 32 438 46
#>
#> $Max
#> Plantio R1+15 V1+15 V3+15
#> IN 339 335 172 468
#> NI 284 160 492 171
#>
#> $Variance
#> Plantio R1+15 V1+15 V3+15
#> IN 5628.7 3550.3 1382.8 11286
#> NI 6489.8 2771.2 553.2 2266
#>
#> $SD
#> Plantio R1+15 V1+15 V3+15
#> IN 75.02466 59.58439 37.18602 106.23559
#> NI 80.55929 52.64219 23.52020 47.60252
#>
#> $`CV(%)`
#> Plantio R1+15 V1+15 V3+15
#> IN 27.50171 25.18360 26.48577 34.94592
#> NI 47.22116 77.18796 5.08875 51.74187
#>
#>
#> -----------------------------------------------------------------
#> f1
#> -----------------------------------------------------------------
#> Mean Median Min Max Variance SD CV(%)
#> IN 238.45 226 83 468 8571.629 92.58309 38.82705
#> NI 198.25 123 32 492 28500.092 168.81970 85.15496
#>
#> -----------------------------------------------------------------
#> f2
#> -----------------------------------------------------------------
#> Mean Median Min Max Variance SD CV(%)
#> Plantio 221.7 227.5 98 339 8287.344 91.03485 41.06218
#> R1+15 152.4 167.0 32 335 10686.933 103.37762 67.83309
#> V1+15 301.3 305.0 83 492 29625.789 172.12144 57.12627
#> V3+15 198.0 183.5 46 468 18507.556 136.04248 68.70832
#>
#> -----------------------------------------------------------------
#>


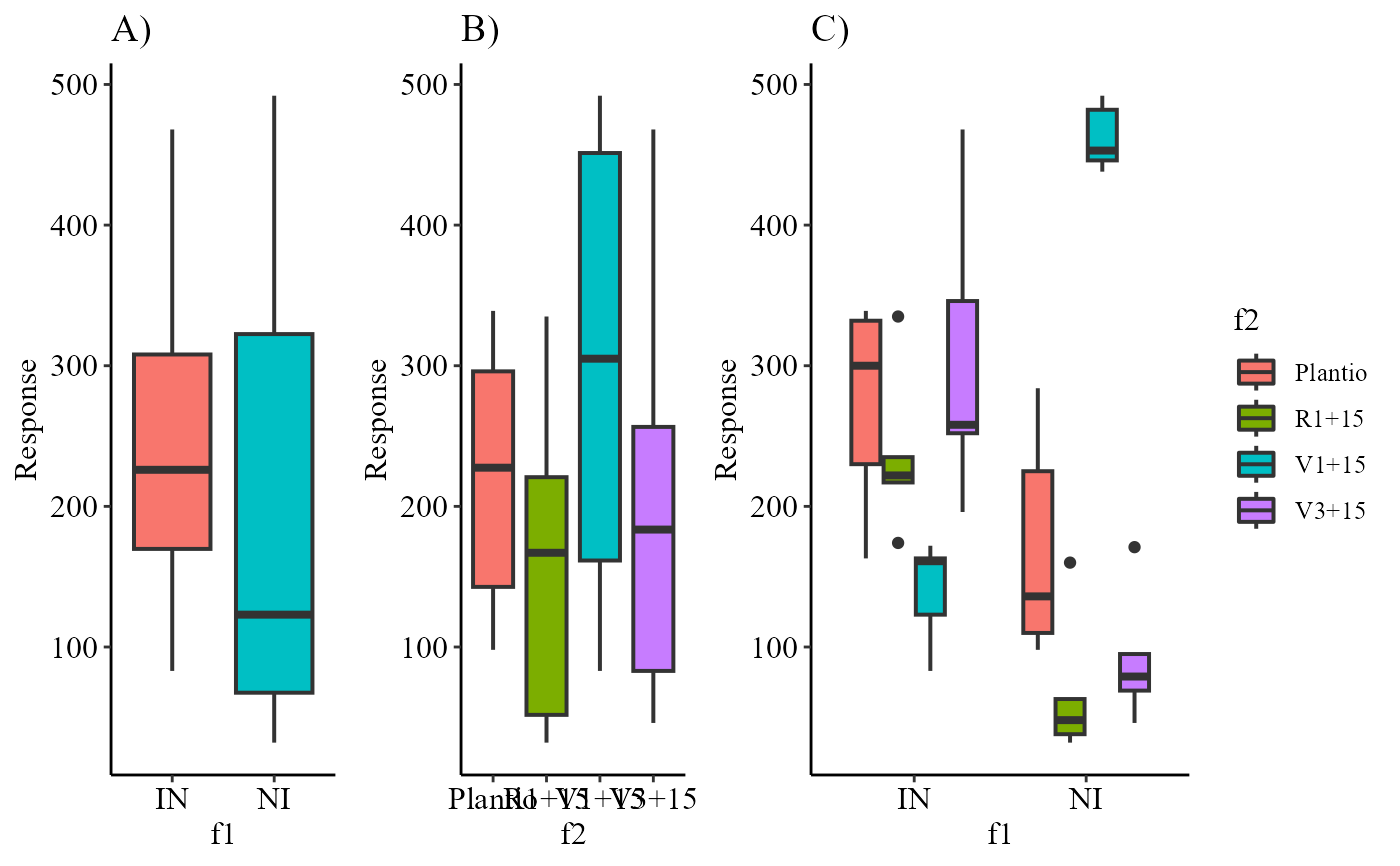
 result$boxplot
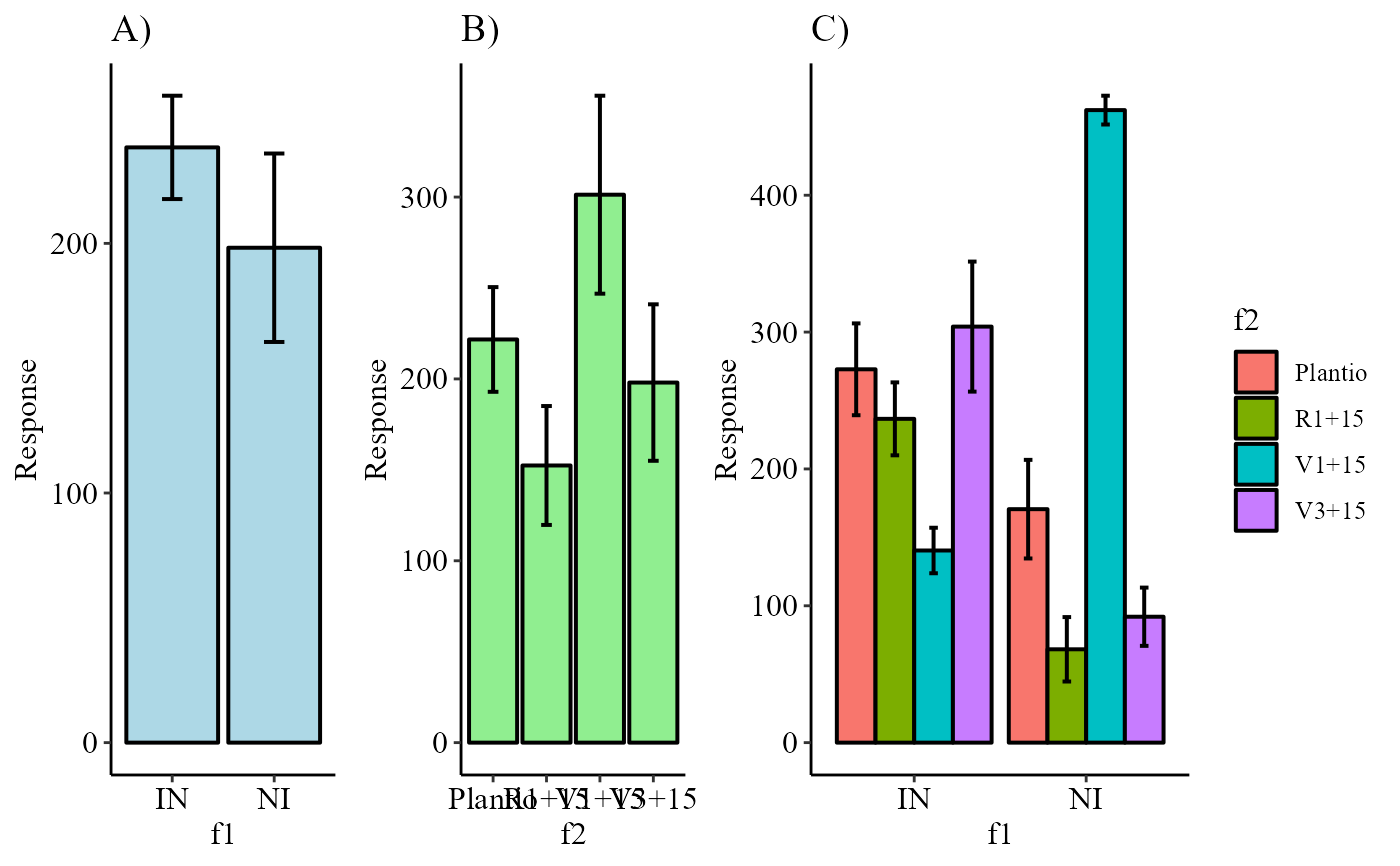
 result$barplot
 result$interaction_plot